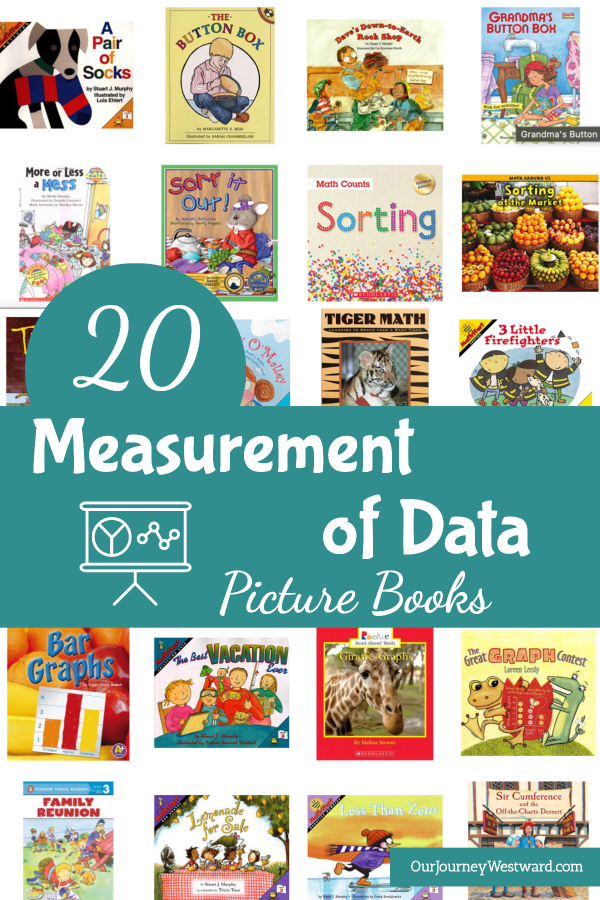
Measurement of Data Picture Books To Help Teach Math
These data picture books will help your preschool, elementary, and even middle schoolers understand sorting and graphing.
Sorting is a skill that is also called categorizing, ordering, classifying, or organizing. It’s simple enough in many cases for preschoolers to do and complex enough that scientists sometimes form teams to figure it out. Either way, it’s important for kids to practice!
Graphing is something we often use to read and analyze data, but it’s also important to be able to create graphs. In fact, learning to create them helps an awful lot in learning to read them. Believe it or not, little ones can build and read easy graphs making it easy to build and create harder ones year after year.
This post contains affiliate links.
Measurement of Data Picture Books
This might sound really strange, but categorizing things – numbers, colors, shapes, data – is a type of measurement! It’s officially called the nominal scale of measurement, but that’s just a fancy name for what we do when we identify, sort, and label things in distinct categories.
Once kids learn to sort, the next reasonable step is to organize the things they have sorted into graphs. Graphs are wonderfully visual ways to see and interpret data. Surprisingly, sorting (and even some simple graphing) can be done with children as young as preschool. While in-depth sorting and graphing is a skill that can reach deep even into the high school years.
Sorting Picture Books
In other words, when a young child helps you sort socks from the laundry basket, they are learning to make important judgments to categorize the socks into specific categories. The black ones go in one pile, the white ones go in another pile, and the striped ones go in yet another pile.
It’s a stretch to call sorting a measurement activity but think of it as a more abstract form of measurement. One of the mind – measuring characteristics and data to order things rightly. This type of measurement is not only mathematical, it very much fits into science and logical thinking, too!
Don’t miss these posts with lesson ideas to teach sorting to all ages: Valentine Math, M&M Math, Candy Classification, Bean Classification
- A Pair of Socks by Stuart J. Murphy
- The Button Box by Margarette S. Reid
- Dave’s Down-to-Earth Rock Shop by Stuart J. Murphy
- Grandma’s Button Box by Linda Williams Aber
- More or Less a Mess by Sheila Keenan
- Sort It Out! by Barbara Mariconda
- Sorting by Henry Pluckrose
- Sorting at the Market by Tracey Steffora
- 3 Little Firefighters by Stuart J. Murphy
Graphing Picture Books
Graphing is another step in this abstract form of measurement that we call measurement of data. Graphs use pictures, bars, lines, and numbers to give clarity and definite information about the sorting and categorizing we do all the time.
Graphing is another skill that I like to spend plenty of hands-on time learning before jumping to reading and writing graphs on paper. Here are some ideas for hands-on experiences for you to use with your children: Paper Airplane Graphing, Candy Graphing, Christmas Glyphs
- Bar Graphs by Vijaya Khisty Bodach
- The Best Vacation Ever by Stuart J. Murphy
- Giraffe Graphs by Melissa Stewart
- The Great Graph Contest by Loreen Leedy
- Family Reunion by Bonnie Bader
- Lemonade for Sale by Stuart J. Murphy
- Less Than Zero by Stuart J. Murphy
- Sir Cumference and the Off-the-Charts Dessert by Cindy Neuschwander
- Tally Cat Keeps Track by Trudy Harris
- Tally O’Malley by Stuart J. Murphy
- Tiger Math by Ann Whitehead Nagda
Helpful Math Products You Might Like
-

-
Math in Nature$20.00
-
Loving Living Math$20.00


Other Posts You Might Like